A paper presented at the National Institute for the Teaching of Psychology, St. Petersburg Beach, FL, January, 1996by Tom Vilberg
Clarion University
Abstract
Concept mapping was utilized in two sections of a course in sensation and perception. In both courses students enhanced their depth of processing of material, enhanced their preparations for class, initiated discussions with the instructor about conceptual organization of material, and generally performed better in the course than students in previous sections not employing concept mapping.
Introduction
Loftus and Collins (1975) proposed the « spreading activation » model of memory. Basically, the model uses a road map metaphor for how memory is organized – concepts in memory are like cities on a road map (« nodes ») while strength of association is represented by distance between cities (« links »). The model, extended by Anderson (1976), has proven useful to the understanding of « priming » but has also recently been utilized as a model for computerized searches of large databases (https://WWW.ANSIM.COM/ME.SHTML).
Not surprisingly, teachers, particularly K-12, began to ask students to produce « concept maps » of their memory. For example, Arnaudin et. al. (1984) demonstrated that student-generated concept maps would reveal misinformation.
As Craik and Lockhart had argued much earlier (1972) that learning and memory are affected, in part, by the « level of processing » engaged by the learner during reversal, several experiments have linked concept mapping to level of processing. For example, Heinze-Fry & Novak (1990) demonstrated that the use of concept maps enhanced learning while Willerman & Mac Harg (1991) argued that student concept maps could be utilized in an anticipatory manner to enhance learning.
Thus, concept maps interface literature on learning and memory, levels of processing, critical thinking, and student expectations.
Methods
Students in two Sensation and Perception courses were taught to produce « concept maps » to relate concepts graphically. On the first day of the semester students were given a handout and a short reading unrelated to the course. They were required to complete an exercise involving both the production of a map and the collaborative production of a subsequent map on the same content. Students were informed that, as part of the course requirements, they would produce concept maps of all of the major topics in the course as well as some of the course readings. They were also told that not all of the maps would be graded and that maps would be included on examinations.
Initially time was allotted from class to prepare several ungraded concept maps. The maps were evaluated and corrected (where errors in fact existed) but not graded. A third map on the content was prepared by students in collaborative groups after each had produced an individual map. Thereafter, every topic in the course was followed by a graded concept map (5 to 10 points each) and every examination had a large concept map instead of an essay.
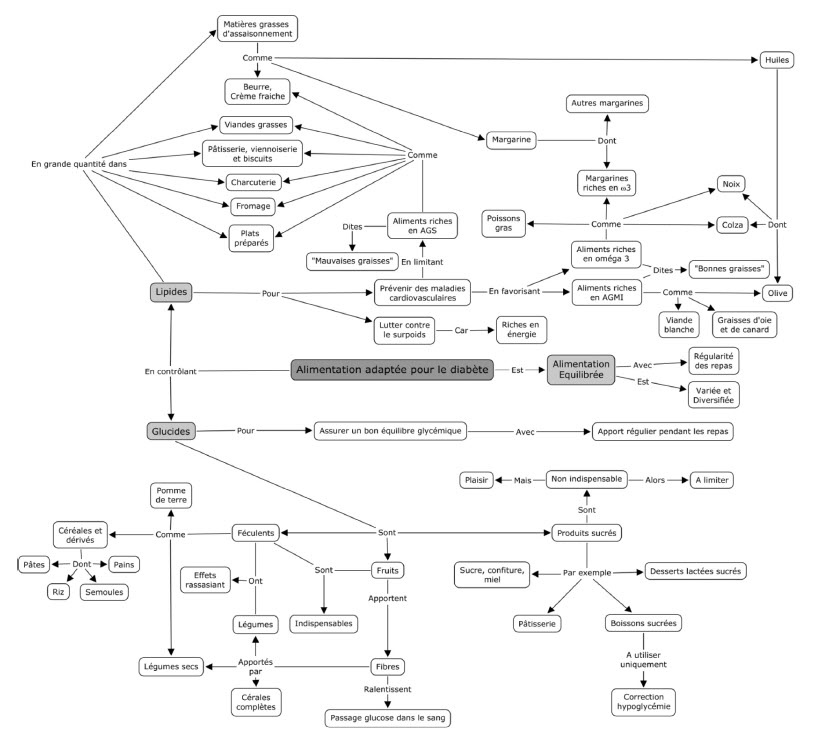
An example Concept Map.

Results and Discussion
Students enhanced depth of processing during lectures. The students in the classes were exceptionally attentive. This was not likely due to the instructor, but likely due to the explicit nature of the concept map assignments. When a concept map would be required, the instructor notified the students at the start of class. This appeared to enhance their attentiveness (if not interest) in the material.
Students enhanced preparation for class. When concept maps were due on readings, virtually all of the students came to class prepared. This contrasts with the same students when they were told that they would have to discuss a reading during the class time, when only about 50% has accomplished the reading. Presumably, the knowledge that their performance would be linked to their course grade as well as the individual nature of most mapping assignments provided additional incentive to come to class prepared.
Students initiated dialogs about the instructor’s metacognition of the course content. It is exceptionally rare for this instructor to have students initiate discussions about the the relationship between concepts in a course. Moreover, in these two courses, across the semester fully one third of the students initiated dialogs outside of class about relationships between topics covered in the previous lecture. Similar dialogs spontaneously occurred between students. These interactions, arguably, reflect extremely deep processing of the material coupled to considerable skepticism and critical thinking. These same dialogs occurred between students when they were asked to produce collaborative concept maps. Then, the discussions focused on what concepts were important, and how concepts related to each other.
Improvement in class performance. In an ordinary section of this class about 10% of the students receive an « A. » When concept mapping was used, 28% and 25% received grades of A. In each case the grading scale required 90% for an A. Three students, independently commented that they found the use of concept maps so beneficial to mastery of material that they used the technique in other courses. It appears likely that mapping enhances grades secondary to enhancing mastery of material.
Problems with concept mapping.
Training . Students must have training on making maps before they are graded. The first several maps generated in these classes were irrelevant to the course topic (one on metabolism, and the other on mammals). For these maps students were provided with a short reading as well as a list of terms for the map. In spite of the added structure, some students found it difficult to organize material in a non-linear manner. Even on collaborative projects, these students produced linked lists rather than maps. The use of maps requires considerable training.
Cognitive processes. Some students asserted that since the map reflected their understanding of material, their map was, by definition, correct. The relatively few students who made this argument generally viewed the maps as « busy work » and produced maps with few concepts and almost no cross links. Whether this reflected the early stages of intellectual development described by Perry (1968) or whether they simply needed additional comparative experiences with concept mapping remains unresolved.
Student expectations. Students made better maps when they knew beforehand that a map would be required. This was most noticeable when students acquired material through non-traditional means. For example, when students viewed a video, they took far more notes when expecting a map than they did when they only expected the movie to be covered on a future exam. While it is possible that the enhanced performance seen through concept mapping is due largely to attentional effects, it is important to notice that the expectation of mapping changed the process of learning. After the first exam, the better students prepared concept maps before each exam. This anticipatory behavior also extended to their notes and the questions they asked in class. It appears unlikely that the overall performance benefits associated with concept mapping would have occured in the absence of explicit course ground rules and consequent student expectations.
Grading concept maps. There was no simple way to grade concept maps. In the past, some have scored the number of concepts on each map while others have differentially weighted the number of cross links (diagonal or horizontal connections). As either scoring method focuses on omission of material, trivial relationships would enhance the point value of a map in the absence of substantive knowledge. In addition to these qualitative and quantitative issues, the unstructured nature of maps made catching errors difficult. It was sometimes difficult to determine the exact nature of the link between concepts on a student’s map. That the instructor saw a potential link was not necessarily isomorphic with an appropriate student link. Finally, as with most assessment measures, once an objective mechanism of assigning points is revealed to the students it appears likely that subsequent assessment would reduce the reliability of the measure. In many respects the maps represent the beginning of a dialog about meaning and importance, not so much the end product of learning.
Tom Vilberg Psychology Dept., Clarion University
Clarion, PA 16214
Phone: (814) 226-2451 Email: vilberg@vaxa.clarion.edu
https://RIVER.CLARION.EDU/TRVILBERG/TRV.HTML


Ajouter un commentaire